

2.2 micrometers.
To generate maximal force, this is the perfect starting length of the sarcomere in the human heart. Any more or less than this initial length and the force that the heart muscle can generate drops. You all remember this as the basis for the Frank-Starling curve where just the right amount of tension (pre-load) is needed to generate optimal squeeze.
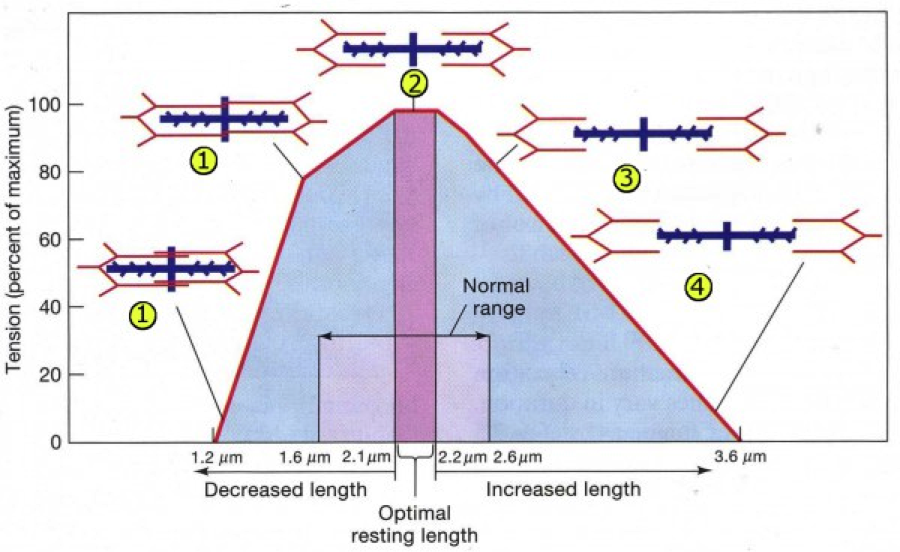
- slidingfilament.webnode.com/applications/length-tension-relationship/
Last month in JAMA, Elliott, et al published the results of an original investigation, Effect of Hospitalist Workload on the Quality and Efficiency of Care.
The authors performed a retrospective cohort study of 20,041 admissions between 2008 and 2011 at Christiana and Wilmington Hospitals in Delaware. The patients were fully admitted (not observation) adult patients, excluding cardiology, oncology, and surgical patients. There was a mix of teaching and non-teaching services, as well as some ICU patients at one of the hospitals. Workload was derived from both RVU’s, as well as billable encounters. The study did a nice job of looking at more than just the usual efficiency measures of length of stay (LOS) and cost. They also looked at a number of other health and experience measures, such as mortality, rapid response team (RRT) activation, 7 and 30 day readmit rates, and patient satisfaction. The models were adjusted for provider continuity, hospital occupancy, and echo turnaround time (a surrogate for system inefficiencies).
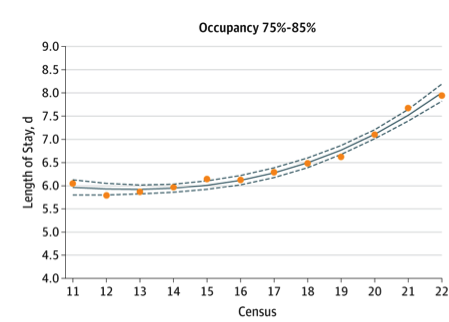
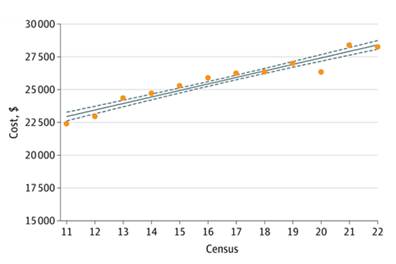
What was found was that LOS and cost, our typical measures of efficiency, both showed negative correlations with increasing workloads. LOS was closer to a Starling curve with approximately 15 patients/day equating to our 2.2 micrometer sarcomere length. Mortality, RRT activation, readmit rates, and even satisfaction all seemed to be unaffected by how busy the hospitalists were. Hospital occupancy rates did seem to affect the curves with low occupancy seeming to align with more hospitalist causes of delays and higher occupancy associated with possible systems issues.
A very concerning trend was seen in that cost was a linear increase moving up and up the higher the number of patients that were cared for during a day.
As hospitalists, we innately feel our own Starling curves. I remember in my early days of being a hospitalist having 8 patients and somehow that filled my whole day. I am sure I did good work on those days, but I also had a lot of downtime where I could have been helping more people. I also remember one particularly horrible day seeing 29 patients covering for a sick colleague back in the days before we had a real backup system. The day ended and 29 patients were alive, but did all of them get the timely and personalized care they deserved? Did all the patients go home and sleep in their own bed who could have?
The Starling curve analogy is an apt one, but only to a point. Indeed, we hospitalists are like individual sarcomeres, tuned and ready to perform, but if we are overwhelmed or conversely not challenged, we likely don’t do our best work. But there are still many factors to be looked at that this study, as an initial look at the topic, did not address.
In the JAMA study by Elliott, et al. we see a great introductory look into trying to understand the forces at play. We also see some areas to explore further that weren’t in this initial cohort. For instance, the role of teaching versus non-teaching services? Or community hospital versus a referral center mix of patients? What about adding in cardiology, surgery and oncology patients? What about observation status, which has only grown in importance since this study cut off in 2011? What would the effects be of geographic based hospitalist units? Especially cogent to our field, the fourth dimension, time, needs to be looked at with more granularity—7 on/7 off? Monday-Friday with weekend coverage? 12’s? 10’s? How does each of these different temporal models affect the quality, experience and affordability outcomes for our patients?
So, is this more than just a Starling curve picture or does it fit another analogy frequently used in modern business circles, “the sweet spot.”
Growing up, I was a tennis player. Long before it became a cliché in business, I vividly remember my tennis coach yelling at me to “Hit the sweet spot!”
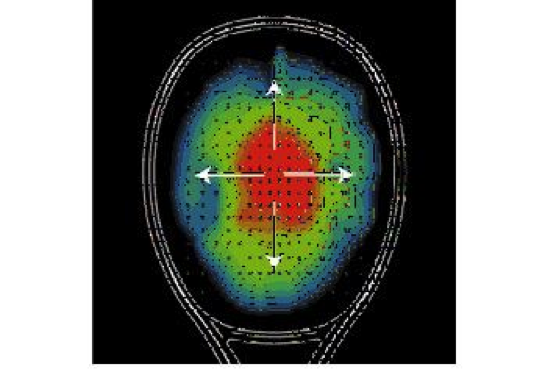
- yonex.com
The sweet spot from a physics perspective is that point on the racket where you get the greatest efficiency of force generated and fewest errant vibrations; it is where the most energy is transferred back into the ball to get it to do what you want it to do. This spot on the racket does have a defined geography (see the red in the picture above), but its efficiency with each hit is greatly affected by the interplay of string length, racket composition, string tension, string density, angle of racket attack, ball recoil, and even wrist and arm size and positioning.
The Starling analogy has things to tell us, but I think the sweet spot model is richer. Fifteen billable patient encounters is not the most important factor in our day. Fifteen observation patients do not equal 15 pneumonias do not equal 15 transplant rejection patients. As hospitalists, it isn’t all just about our individual capabilities and the patient load, but (as the paper alludes to with hospital bed capacity) it involves a much more complex interplay of inputs, some even competing against each other. Future studies will look into these multiple other factors and give us information that will help us create systems to tune our work much better than the trial and error methods of the last 20 years.
Right now, we all can tell when we are falling outside the Starling curve of our own efficiency – being able to tell when things aren’t working feels intuitive. But we also have those days when everything goes great: we saw our patients in a timely fashion, spent quality time “counseling and coordinating care,” made some good clinical decisions and utilized our scarce resources well. We just don’t have a good sense why it went well. I don’t think it was all because we had 13 patients instead of 16. We don’t yet understand the myriad of factors at play that make that day an excellent one for ourselves and our patients – what it takes to truly “hit the sweet spot.”
Appreciate the blog post. Yes, the findings of the study may be somewhat common sense, but good to have data to support it. Though this study did not have comments/results on adverse effects on patient safety another study did by Michtalik 2013 – http://archinte.jamanetwork.com/article.aspx?articleid=1566604