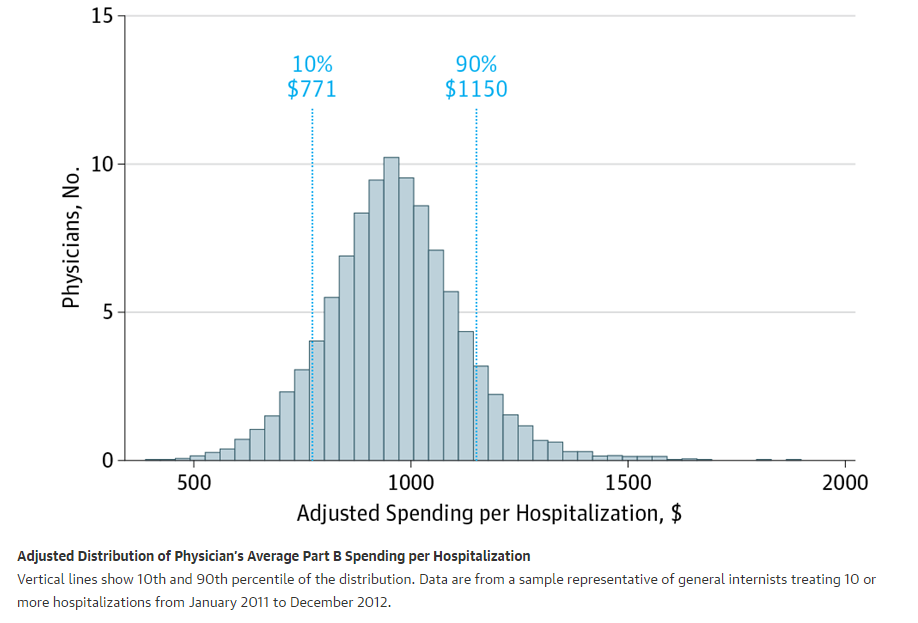
I have been and will be light on the blogging these days. However, a new JAMA online first study out looking at hospitalist Part B cost variation deserves some attention. Bestill my heart. It’s not about groups. It’s about individual physicians. The gap between high- and low-spending doctors in the same hospital was larger than the gap in spending between hospitals.
From the editorial:
In this issue, Tsugawa et al3 analyze spending by individual physicians in relation to patient outcomes. The research team compared Medicare Part B spending per hospitalization by hospitalists practicing within the same hospital. To profile each physician’s level of spending, average Part B spending per hospitalization for 2011 and 2012 was used, then applied to clinical outcomes (30-day readmission and 30-day mortality rates) for 2013 and 2014. The split-sample approach mitigates bias if a physician treats a complex set of patients in one year and therefore has higher spending and worse outcomes. Despite a 40% difference in average spending propensity per hospitalization between the highest ($1055) and lowest ($743) quartiles of physicians, there were no differences in either clinical outcome.
Here is the table with the absolute figures:

I am not surprised by the results. There is always intragroup variation, and some hospitalists may code with more intensity, astutely augment with more modifiers or opportunities to collect, or just take more time. However, outcomes don’t vary (readmissions and mortality), and the minor variation between groups likely results from a smoothing out effect–especially now since teams have gotten so large.
It’s worth a look, though. The findings in the outcomes and the underlying causes for outlier status are where the fun is. Also, with MIPS and MACRA, cost reports report cards will be front and center–like it or not.


Leave A Comment