

Some of you might know CMS released our Part B productivity data earlier in 2014. We have discussed on the policy side of SHM how we might use the data to learn about our field. Unlike other specialties, we do not have a unique billing identifier. Without the information, we cannot easily interrogate the database and view the patterns of the more than 40,000 hospital-based practitioners within our healthcare system. The absence of such a feature creates gaps in our learning. And as they say, you can’t manage what you can’t measure.
We will acquire a unique code at some point, my conjecture, but until we do, we use inpatient-billing figures to assist in tagging physicians who practice hospital medicine.
Most guess ambulatory docs do not bill greater than 25% of their codes on the hospital side, and as the hospitalist majority have their boards in IM or FP (or peds), one could assume an internist or family practitioner with a bulk of their chits billed as 99221-3, 99231-3, and 99238-9 would be a hospitalist. Not perfect, but I would say very close. In fact, most studies looking to identify hospitalists use the same methodology.
With the above in mind, I wished to use inpatient codes to identify top-tier, productive hospitalists. Further, I hoped to convey a best practice or two plied by these physicians to absorb how they organize their day and advantage ancillary staff or resources.
I assumed 15-25 daily encounters as a range—but by no means can we distinguish a sweet spot. Moreover, as we all can attest, you have seen one hospitalist program; you have seen one hospitalist program. We do not know the correct amount for any one practitioner in any practice. Nonetheless, since we have access to a national database, why not see who topped the list.
Using the CMS treatment tracker at ProPublica (you can find other iterations as well), I contained my search to only inpatient codes. Also note, the database only contains Medicare data. We cannot obtain commercial, Medicaid, or self-pay information.
You can appreciate why health policy researchers have fits with our “best system in the world” resource base. Think of what we could discover if we had access to a full tilt boogie IT infrastructure with all the bells and whistles. A “learning healthcare system” happens to be the term in vogue nowadays, but you can use your imagination as to what trends might come to light.
So I did some crunching.
Below you can see the search results for codes 99238 and 99239 (discharge codes), greatest in national frequency for 2012. While discharges may signify only a portion of daily work, they represent a reasonable snap shot of face-to-face encounters. They were a logical proxy for a maiden inspection.
99239:
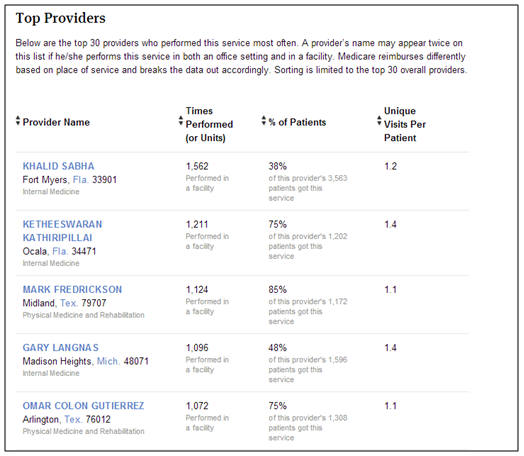
99238:
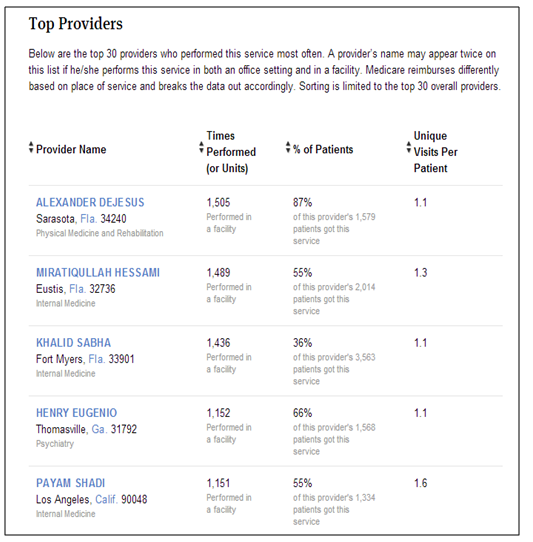
Dr. Khalid Sabha had productive Medicare discharge numbers, summing close to 3,000 in 2012. He also had sturdy initial and subsequent visit tallies. In preparing the post, I reached out to him by email and spoke to his practice administrator. Regrettably, he did not want to comment on the data. I aspired to learn if he leveraged NP and PAs or other unique resources to assist his group. He still gets recognition for top discharge prize though.
Regardless, you can check your own data or those of your practice partners. You can also review your charges, doctors within your referral network, and state rankings for each productivity measure. CMS has made Part B billing 100% transparent, any errors aside (always possible), so please observe what they have made available. Patients, your hospital, and any interested party can compare and contrast these files. A venue to judge your efficiency against others, in addition to engaging in back of the envelope QI—perhaps we can use some of what we have handy to better perceive local and national trends through our PCs. The future will be an interesting place to practice.
PRO-TIP: To query based on CPT designation, click here and change the last five digits of the html address to the code of interest. The one provided embeds 99233: subsequent visit, high complexity (h/t Charlie Ornstein).
BONUS: Also, see these two Annals of Internal Medicine commentaries (August 2014) discussing what the data release means to medicine, pro and con.
Leave A Comment